Homelab State of the Union 2026
Introduction
This is the first writeup of the state of my homelab. A sort of state of the union. It’s been in my mind for a while to do such a writeup, mostly to encourage myself to write a summary and reflect on next steps, but also to share and perhaps get input from others. It’s also inspired by the Linux Unplugged Podcast which recently had their 646: The Great Holiday Homelab Special 🎄 episode, as well as their recent “config review” episodes.
Why homelab at all?
I used it as a verb just there, but what does “homelab” even mean? The word suggests that it’s a lab in one’s home. A lab where one can safely do experiments and try out things, without risking too much - as opposed to in an enterprise environment at work, where mistakes are costly and to be avoided. To me it means “the IT infrastructure that I run in my home”, or “the computers/machines/servers at home”, and it includes the stuff I run on those machines.
So why do I have servers at home, and what purpose do they serve? My motivations are currently, as I reflect on them, in this order of priority:
- To learn and have fun. I’m a big nerd after all.
- To self-host the things that I can, so that I don’t share much personal information with third parties.
- To not risk losing data that’s important to me. If you suddenly lose your account with one of the large tech companies, that could mean (depending on your own setup) losing all your family photo albums, all your email, etc. More self-hosting means less reliance on the big tech companies, and staying in control of your own data.
Philosophy of the homelab
My main goals here are to:
- Spend as little time as possible on maintenance
- Spend as little time as possible on configuring things and figuring out how to make things work
And how I reach this is to have a declarative approach to configuring my homelab. I use nix and NixOS (https://nixos.org) as much as possible, so that I can declaratively state what I want running on my servers, rather than having to manually set things up imperatively.
Hardware
Current hardware
I have these physical machines:
- MiniPC at home, in my living room
- An old Synology NAS, in our guest room/office
- MiniPC at my mother’s house (identical to the one at home)
The mini PCs are almost identical: ASUS P53, Ryzen 7 7735H, 32GB/64GB memory, 2TB nvme disk. The one at home runs Proxmox and the one at my mother’s house runs NixOS. The Synology NAS is mostly a sidequest for now, but I do use it for image backups and for media. More on both later.
I also have a few laptops, phones, and tablets.. But these don’t run any services - they only consume them.
Why this hardware
Previously I had 3-4 raspberry pis that were my homelab. They were all Raspberry PI 3, or Raspberry PI 3B(+?). This was fun, at first, but after a while I got more and more frustrated with
- SD cards failing
- Apps not working at all on ARM
- Apps not working as expected on ARM
- Not being able to use Nix and NixOS as much as I would like. Though I previously wrote about How to install NixOS on a Raspberry Pi 3b.
And in the end I decided that life is too short, and that I would like to spend more time on features (getting apps to work and serve my needs) and less time on debugging and figuring out how to make things work (setting up a deployment flow for the raspberries, or trying to create arm builds for various apps). I wanted more of a “golden path”, and I decided that x86 and more Nix is the way forward. I only regret not landing on that decision sooner.
Networking
I use tailscale to connect these together so that they can all reach each other. It’s incredibly valuable to be able to reach all my home services through my phone, no matter where I am.
All the virtual machines in Proxmox share the same network. This is something that I may look into improving in the future. There’s no need for my Jellyfin VM to reach my Audiobookshelf VM, after all.
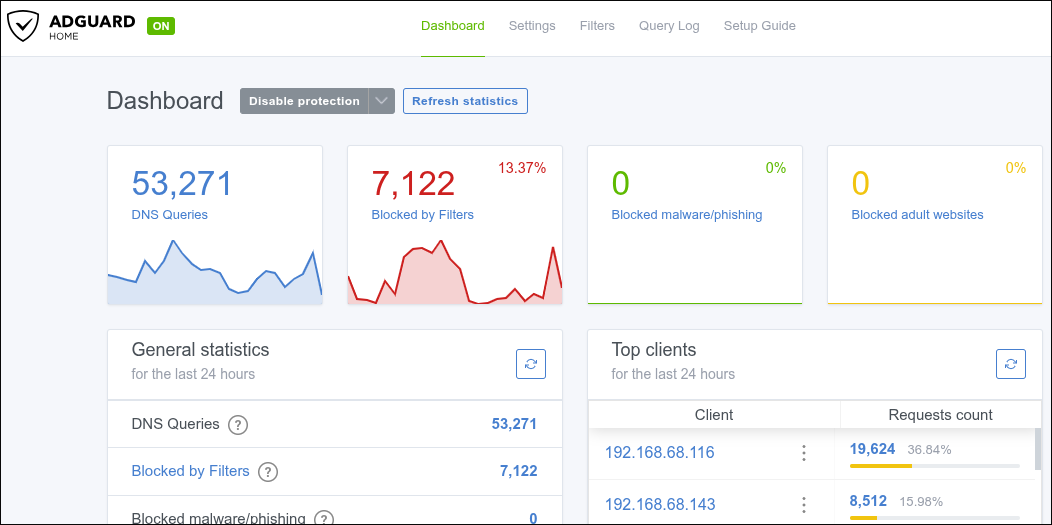
I do run a VM with Adguarder, and my home router points to that as the DNS server. This allows me to block most annoying ads and trackers online. Here’s a screenshot of the dashboard:
Deployment
I use colmena as the deployment tool, both for my VMs running NixOS, and for my personal laptops running NixOS.
Deploying to a VM looks like this:
~/devp/dotfiles on main ⌚ 13:08:27
$ nix develop
[stian@stian-dell-nixos:~/devp/dotfiles]$ colmena apply --on immich
[INFO ] Using flake: git+file:///home/stian/devp/dotfiles
[INFO ] Enumerating nodes...
evaluation warning: 'system' has been renamed to/replaced by 'stdenv.hostPlatform.system'
[INFO ] Selected 1 out of 8 hosts.
✅ 29s All done!
immich ✅ 21s Evaluated immich
immich ✅ 5s Built "/nix/store/hy77b57pcybqa395hn46gx82xd5mpgf1-nixos-system-immich-26.05pre-git"
immich ✅ 1s Pushed system closure
immich ✅ 2s Activation successful
While deploying to my local laptop looks like this:
[stian@stian-dell-nixos:~/devp/dotfiles]$ colmena apply-local --sudo
[INFO ] Using flake: git+file:///home/stian/devp/dotfiles
stian-dell-nixos | Evaluating stian-dell-nixos
stian-dell-nixos | Evaluated stian-dell-nixos
stian-dell-nixos | Building stian-dell-nixos
stian-dell-nixos | /nix/store/pj2xsk05m9l8mmn944wq5y11l5hdackr-nixos-system-stian-dell-nixos-25.05pre-git
stian-dell-nixos | Built "/nix/store/pj2xsk05m9l8mmn944wq5y11l5hdackr-nixos-system-stian-dell-nixos-25.05pre-git"
stian-dell-nixos | Pushing system closure
stian-dell-nixos | Pushed system closure
stian-dell-nixos | No pre-activation keys to upload
stian-dell-nixos | Activating system profile
stian-dell-nixos | activating the configuration...
stian-dell-nixos | setting up /etc...
stian-dell-nixos | reloading user units for stian...
stian-dell-nixos | restarting sysinit-reactivation.target
stian-dell-nixos | the following new units were started: fwupd-refresh.service, fwupd.service, NetworkManager-dispatcher.service, sysinit-reactivation.target, systemd-tmpfiles-resetup.service, udisks2.service
stian-dell-nixos | Activation successful
stian-dell-nixos | No post-activation keys to upload
                 | All done!
I like colmena a lot!
Creating new virtual machines
My current process for creating new NixOS VMs is very manual. I have a checklist of sorts in my obsidian notes. It’s roughly this:
- Get a recent NixOS iso onto proxmox
- Create a new VM manually in the proxmox user interface
- Configure the VM to autostart when proxmox boots
- Go through the NixOS installer in the VNC console
- When the NixOS system first boots, after the installation, I go through these steps through the VNC console in proxmox:
- sudo su
- ifconfig # to see the ip of the machine on the local network, though I can also find this through my router
- cd /etc/nixos/
- nano configuration.nix
- networking.hostName = “some-hostname”;
- services.openssh.enable = true;
- services.tailscale.enable = true;
- add neovim and tmux to packages
- nixos-rebuild switch
- sudo reboot now
- Then I SSH into the new VM from my own laptop, and perform these steps:
- sudo tailscale up
- sudo nvim /etc/nixos/configuration.nix
- Here I usually copy the configuration.nix from a previous VM and make adjustments to fit the usecase for the new VM.
- sudo nixos-rebuild switch
- Finish setup in my dotfiles repo so that I can deploy with colmena
- Update my observer VM configuration to also scrape prometheus metrics from the new VM
This process works, but I’d like to update it so that I can avoid using the proxmox user interface manually (terraform?), and so that I can prebuild the NixOS image with my configuration baked in.
Services
Automating the Home - Home Assistant
I recently started using Home Assistant to control most of our devices at home. Mostly due to the frustration around having to use X different applications and user interfaces to control things, and having only a very few of them actually being any good. And it’s nice to be able to connect things together, such as automatically turning lights and other devices off when we go to sleep, or automatically taking the blinds down if there’s too much sun.
I’ve used the Proxmox VE Helper-Scripts Home Assistant OS to set up my Home Assistant VM, and I’ve configured proxmox to pass through a Conbee USB Zigbee Dongle to it so that I can use Zigbee. This VM works well, but I would like to do things declaratively at some point. Maybe I can use Home Assistant with NixOS? I do need to keep Home Assistant configurable through the GUI to satisfy other members of the home, but maybe I can get at least some things declared with nix.
The most recent things I’ve added to Home Assistant are:
- I added a smart plug that provides power consumption to our dishwasher so that we can get a notification when it’s done (when power consumption has been high, but then goes under 1W for more than 3 minutes).
- I got a few Aqara water leak sensors to notify us if there might be a water leakage near our water heater.
- I tried to create an automation that, when we turn off our chromecast, will also turn off our older LG webos TV. This used to work on its own when the chromecast was plugged directly to the TV, but since we got a soundbar in between those two, it stopped working. My automation seems to randomly, on normal clicks on our chromecast remote, lead to the TV being turned off even though we never sent any shutdown commands to the chromecast. Fun times!
Syncing Data - Syncthing
I used to pay for Dropbox, and had it in my mind over many years to switch that out for something else where I didn’t risk someone else reading all my data. When I finally got to it, and switched to using Syncthing, I only regretted not getting to it sooner. It’s very easy to set up, and works very well. I’ve had zero issues with it.
The NixOS config to use it is very simple:
  services.syncthing = {
    enable = true;
    openDefaultPorts = true;
    guiAddress = "0.0.0.0:8384";
  };
Blocking Trackers - AdGuard Home
If you’ve heard of pi-hole, then you have a rough idea of what AdGuard Home does. It allows you to easily block a lot of network traffic.
The NixOS config to get Adguarder running is very simple:
  services.adguardhome = {
    enable = true;
  };
When you’ve configured your router to use Adguard Home as the DNS server, you’ll start getting fun stats like in the screenshot further up (under networking).
The Observer VM - Prometheus, Grafana, Alertmanager
The VM named “observer” runs Prometheus, Grafana, and Alertmanager, and it’s responsible for gathering metrics and making sure that I get alerted when bad stuff happens. All VMs are running node exporter, and prometheus is configured to reach out to all other VMs (through the tailscale addresses) and scrape metrics. prometheus also scrapes metrics offered by syncthing……
The configuration for this VM is slightly more complicated, but not much. Let’s look at Grafana first:
  services.grafana = {
    enable = true;
    settings = {
      server = {
        http_addr = "127.0.0.1";
        http_port = 3001;
      };
    };
    provision = {
      enable = true;
      datasources.settings.datasources = [
        {
          name = "Prometheus";
          type = "prometheus";
          url = "http://${config.services.prometheus.listenAddress}:${toString config.services.prometheus.port}";
          isDefault = true;
          editable = false;
        }
      ];
      dashboards.settings.providers = [
        {
          name = "my dashboards";
          disableDeletion = true;
          options = {
            path = "/etc/grafana-dashboards";
            foldersFromFilesStructure = true;
          };
        }
      ];
    };
  };
We state that it should be enabled, which port it should run on, and that I would like to provision a data source and a dashboard (the Node Exporter Full dashboard).
Prometheus and Alertmanager is more complex:
  services.prometheus = {
    enable = true;
    port = 9001;
    exporters = {
      node = {
        enable = true;
        enabledCollectors = [ "systemd" ];
        port = 9002;
      };
    };
    # Enable and configure Alertmanager
    alertmanager = {
      enable = true;
      port = 9093;

      configuration = {
        route = {
          receiver = "pushover";
          group_by = [
            "alertname"
            "instance"
          ];
          group_wait = "10s";
          group_interval = "5m";
          repeat_interval = "3h";
          # Drop alerts from laptops (no notifications)
          routes = [
            {
              receiver = "devnull";
              matchers = [ "instance=~\"stian-dell-nixos\"" ];
            }
          ];
        };
        receivers = [
          {
            name = "pushover";
            pushover_configs = [
              {
                token = "redacted";
                user_key = "redacted";
                send_resolved = true;
                title = "{{ if .CommonAnnotations.summary }}{{ .CommonAnnotations.summary }}{{ else }}{{ .CommonLabels.alertname }} on {{ .CommonLabels.instance }}{{ end }}";
                message = "{{ range .Alerts }}• {{ if .Annotations.description }}{{ .Annotations.description }}{{ else }}{{ .Labels.alertname }} on {{ .Labels.instance }}{{ end }}{{ end }}";
              }
            ];
          }
          { name = "devnull"; }
        ];
      };
    };
    # Point Prometheus to the local Alertmanager
    alertmanagers = [
      {
        static_configs = [
          { targets = [ "127.0.0.1:${toString config.services.prometheus.alertmanager.port}" ]; }
        ];
      }
    ];
    ruleFiles = [
      (pkgs.writeText "alerts-node.yml" ''
        groups:
          - name: node-health
            rules:
              - alert: InstanceDown
                expr: up == 0
                for: 5m
                labels:
                  severity: critical
                annotations:
                  summary: 'Instance {{ $labels.instance }} is down'
                  description: 'No scrape target responding for 5 minutes.'

              - alert: HighCPUUsage
                expr: 100 - (avg by (instance) (rate(node_cpu_seconds_total{mode="idle"}[5m])) * 100) > 90
                for: 15m
                labels:
                  severity: warning
                annotations:
                  summary: 'High CPU on {{ $labels.instance }}'
                  description: 'CPU > 90% for 15m.'

              - alert: LowMemoryAvailable
                expr: (node_memory_MemTotal_bytes - node_memory_MemAvailable_bytes) / node_memory_MemTotal_bytes * 100 > 90
                for: 15m
                labels:
                  severity: warning
                annotations:
                  summary: 'Low memory on {{ $labels.instance }}'
                  description: 'Memory usage > 90% for 15m.'

              - alert: DiskSpaceLow
                expr: 100 * (1 - (node_filesystem_avail_bytes{fstype!~"tmpfs|ramfs|overlay"} / node_filesystem_size_bytes{fstype!~"tmpfs|ramfs|overlay"})) > 90
                for: 30m
                labels:
                  severity: warning
                annotations:
                  summary: 'Low disk space on {{ $labels.instance }} {{ $labels.mountpoint }}'
                  description: 'Disk usage > 90% for 30m.'
      '')
      (pkgs.writeText "alerts-syncthing.yml" ''
        groups:
          - name: syncthing
            rules:
              - alert: SyncthingNoPeersButPending
                expr: (sum by (instance) (syncthing_connections_active{job="syncthing"})) == 0
                  and on (instance)
                  (sum by (instance) (syncthing_model_folder_summary{job="syncthing",scope="need",type="bytes"}) > 0)
                for: 10m
                labels:
                  severity: warning
                annotations:
                  summary: 'Syncthing has no peers while pending data on {{ $labels.instance }}'
                  description: 'There is pending data but all peer connections are down for 10m.'

              - alert: SyncthingStalledTransfers
                expr: (sum by (instance, folder) (syncthing_model_folder_summary{job="syncthing",scope="need",type="bytes"})) > 0
                  and on (instance, folder)
                  (sum by (instance, folder) (rate(syncthing_model_folder_processed_bytes_total{job="syncthing"}[10m])) < 1)
                for: 20m
                labels:
                  severity: warning
                annotations:
                  summary: 'Syncthing stalled for {{ $labels.folder }} on {{ $labels.instance }}'
                  description: 'Pending bytes but almost no processed bytes for 20m.'

              - alert: SyncthingFolderOutOfSyncLong
                expr: sum by (instance, folder) (syncthing_model_folder_summary{job="syncthing",scope="need",type="bytes"}) > 0
                for: 12h
                labels:
                  severity: info
                annotations:
                  summary: 'Folder {{ $labels.folder }} out of sync on {{ $labels.instance }}'
                  description: 'Non-zero "need" for more than 12h.'

              - alert: SyncthingFolderErrors
                expr: rate(syncthing_events_total{job="syncthing",event="FolderErrors",state="created"}[5m]) > 0
                for: 5m
                labels:
                  severity: warning
                annotations:
                  summary: 'Syncthing reports folder errors on {{ $labels.instance }}'
                  description: 'Error events detected in the last 5 minutes.'
      '')
      (pkgs.writeText "alerts-borg.yml" ''
        groups:
          - name: borg-backup
            rules:
              - alert: BorgBackupTooOld
                expr: (time() - borg_backup_last_success_timestamp_seconds) > 172800
                for: 1h
                labels:
                  severity: warning
                annotations:
                  summary: 'Borg backup on {{ $labels.instance }} is too old'
                  description: 'Last successful backup was more than 48 hours ago.'
      '')
    ];
    scrapeConfigs = [
      {
        job_name = "scraper";
        static_configs = [
          {
            targets = [ "127.0.0.1:${toString config.services.prometheus.exporters.node.port}" ];
            labels = {
              instance = "observer";
              job = "node";
            };
          }
          {
            targets = [ "immich:9002" ];
            labels = {
              instance = "immich";
              job = "node";
            };
          }
          {
            targets = [ "stian-dell-nixos:9002" ];
            labels = {
              instance = "stian-dell-nixos";
              job = "node";
            };
          }
          {
            targets = [ "adguarder:9002" ];
            labels = {
              instance = "adguarder";
              job = "node";
            };
          }
          {
            targets = [ "audiobookshelf:9002" ];
            labels = {
              instance = "audiobookshelf";
              job = "node";
            };
          }
          {
            targets = [ "syncthing:9002" ];
            labels = {
              instance = "syncthing";
              job = "node";
            };
          }
          {
            targets = [ "jellyfin:9002" ];
            labels = {
              instance = "jellyfin";
              job = "node";
            };
          }
        ];
      }
      # Scrape Syncthing's metrics endpoint directly with an API key.
      {
        job_name = "syncthing";
        metrics_path = "/metrics";
        scheme = "http";
        static_configs = [
          {
            targets = [ "syncthing:8384" ];
            labels = {
              instance = "syncthing";
              job = "syncthing";
            };
          }
        ];
        authorization = {
          type = "Bearer";
          credentials = "redacted";
        };
      }
    ];
  };
But it’s not too bad. In short, we
- enable prometheus
- enable node exporter (on the observer vm itself)
- enable alertmanager
- configure Pushover as the receiver for alerts
- point Prometheus to the local Alertmanager
- configure alerts
- basic alerts (in the file “alerts-node.yml”) for all VMs
- syncthing-specific alerts (in the file “alerts-syncthing.yml”)
- an alert based on a custom metric that has to do with Borg backups (in the file “alerts-borg.yml”) - more on that later
- configure scrape targets that Prometheus will gather metrics from
I like the observer VM a lot. The configuration isn’t too complex, and I can monitor and alert to my heart’s desire.
The Media Server - Jellyfin
I’m very new with media servers. So far I’ve only set up the VM, loaded in some personal videos, and we have not really used it yet.
The nix config to get started is simple:
  services.jellyfin = {
    enable = true;
    openFirewall = true;
  };
I’ll throw in this too - how I’m mounting some shared folders from my old Synology NAS:
  # NFS mounts from Synology
  fileSystems."/mnt/media" = {
    device = "192.168.68.153:/volume1/media";
    fsType = "nfs";
    options = [
      "x-systemd.automount"
      "noauto"
      "x-systemd.idle-timeout=600"
    ];
  };
But again: We are not really using this yet.
Image Hosting - Immich
I had the idea to use immich to replace Google Photos for what feels like years. A couple of months ago we finally got started using it.
Getting started is, not surprisingly, easy with NixOS:
  services.immich = {
    enable = true;
    port = 2283;
    host = "0.0.0.0";
  };
And if you also have your VMs on Tailscale, then you can configure the immich app on your phone to connect to the tailscale address, and it’ll just.. work! Well, kind of. We discovered that it was much better to configure the immich app to use the local network address for the immich server, so that photo and video uploads mostly happen on the home wifi, but to add the tailscale address as a secondary option in the immich app. Then, if we really want to, we can go on the tailscale network and have photos be backed up even though we’re not at home. But we mostly just wait until we’re home and then it happens in the background.
The most recent improvement to immich happened over the Christmas holidays. I set up backup jobs using BorgBackup - more on that later.
Audiobooks - Audiobookshelf
audiobookshelf is like having your own selfhosted Audible. I like this a lot. I can listen to my audiobooks in the android app, in the web app, and since I’ve logged in it’ll sync my progress across devices. Works like a charm!
Recently I’ve downloaded audiobooks from LibriVox -free public domain audiobooks. I’ll recommend a couple from H. G. Wells: War of the Worlds, and The First Men in the Moon.
Backup Solution
The most recent innovation in the homelab overall is that I’ve started to use BorgBackup to backup the most important data that we have.
There’s a great NixOS module for borg. Here’s an example of how I use it to backup data from immich:
  services.borgbackup.jobs.immich-backup = {
    # Select the paths I'd like to backup:
    paths = [
      "/var/lib/immich"
      "/var/backup/postgresql"
    ];
    # Here you can see that the borg repo, where the backup is stored, in on another machine named "offsite-vm"
    repo = "ssh://stian@offsite-vm/home/stian/immich-backup";
    encryption = {
      mode = "repokey";
      passCommand = "cat /root/borg_passphrase";
    };
    environment.BORG_RSH = "ssh -i /root/.ssh/id_ed25519 -o StrictHostKeyChecking=no";
    compression = "auto,lzma";
    startAt = "daily";
    readWritePaths = [
      "/var/backup"
      lastImmichBackupJob
    ];
    # Configure a script to be ran before we do the backup. We stop immich first, then we do a db dump
    preHook = ''
      ${pkgs.systemd}/bin/systemctl stop immich-server
      # Dump the 'immich' database. Adjust user/db name if different.
      ${pkgs.sudo}/bin/sudo -u postgres ${pkgs.postgresql}/bin/pg_dump immich > /var/backup/postgresql/immich.sql
    '';
    # After the above preHook, the actual backup of the data (images, videos, etc.) and database (the db dump) happens.
    # Below is a script that's executed after the backup, which starts immich again, and then writes a timestamp to a file which I'm monitoring and alerting on
    postHook = ''
      ${pkgs.systemd}/bin/systemctl start immich-server

      # Write metric for Prometheus. This only runs if the backup command succeeded.
      echo "borg_backup_last_success_timestamp_seconds{backup_name=\"immich\"} $(date +%s)" > ${lastImmichBackupJob}/borg_immich.prom
    '';
    prune.keep = {
      daily = 7;
      weekly = 4;
      monthly = 6;
    };
  };
This is not too complicated, it works very well, and I can sleep without worrying whether all our family photos will be lost if my home server dies. I have a backup on my remote server! Recall the “alerts-borg.yml” file in the observer VM? That’s where I’ve configured an alert which notifies me if the most recent backup job is too old.
In addition to backup jobs like the above one, I do a manual copy of all the important data onto a USB drive a couple of times a year.
Next steps / future goals
In the future I’d very much like to improve the process for creating VMs. I’d like to use Terraform/OpenTofu to avoid clickops. I’d also like to do better with regard to secret management. I cannot share my homelab repo as it is, because I may have one or two secrets hardcoded in there. Maybe sops-nix is something to consider?